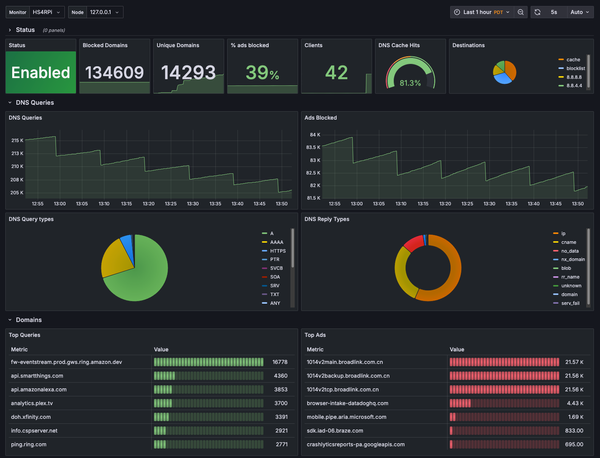
Monitoring Pi-hole with Prometheus and Grafana Use pihole-exporter to collect Pi-hole metrics in Prometheus and build custom dashboards in Grafana to monitor DNS queries, block rates, and more.
Tip: Minimizing Disk Writes in Prometheus Agent Do you want to entirely disable disk writes when running Prometheus Agent? Learn how to reduce your storage media wear by configuring Prometheus for full in-memory operation!
Scalable Server Monitoring With Prometheus Monitor multiple servers efficiently with Prometheus in Agent Mode, a scalable setup that optimizes resource use while centralizing metrics in Grafana.
Tip: Configuring process-exporter to Better Track HomeSeer and Plugins Learn how to configure process-exporter to properly display HomeSeer’s HSConsole and plugin names instead of just ‘mono’.
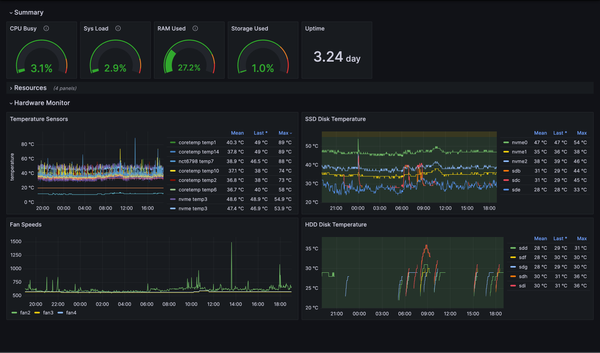
Real-Time Server Monitoring with Prometheus and Grafana Keep tabs on your Linux server’s health in real-time. Use Grafana to monitor CPU, memory, storage, process and container metrics.