If you’re running Pi-hole as your network-wide ad blocker, chances are you’ve wondered how to get better visibility into its performance over time. The built-in web UI gives you a quick glance at queries and block stats, but it’s limited when you want historical trends, custom alerts, or centralized monitoring.
That’s where pihole-exporter comes in. It’s a small service that scrapes stats from your Pi-hole instance and exposes them in a format that Prometheus understands. From there, it’s easy to build Grafana dashboards, set up alerts, and monitor multiple Pi-hole instances if needed.
In this post, I’ll walk through how to set up pihole-exporter, connect it to Prometheus, and create a basic Grafana dashboard to visualize your DNS traffic and block statistics. Whether you’re self-hosting at home or running Pi-hole remotely with something like Tailscale, this setup helps you keep a close eye on what’s happening in your network.
What You'll Need
The steps on this article are meant to built on top of the work we've done in previous articles. In particular, you'll need:
- A working instance of Pi-hole. You can find a step-by-step guide in the article: Pi-hole: Ad-blocking for all your devices.
- A central monitoring stack with Prometheus and Grafana. We cover the process to set this up, in detail, in the article: Real-Time Server Monitoring Stack with Prometheus and Grafana.
- Prometheus agent running on your Pi-hole node. You should have configured Prometheus to remote-write metrics to the central monitoring stack. We cover how to set this up in the article: Scalable Server Monitoring With Prometheus.
- We will be using Portainer for deployment, so you'll need to have a working Portainer Server and, assuming your Pi-hole is a separate node on your network, you'll need to have Portainer Agent setup as well. I cover both steps in detail in the articles Simple Container Management With Portainer and Portainer Agent: Managing Containers Across Servers respectively.
Step-by-Step Guide
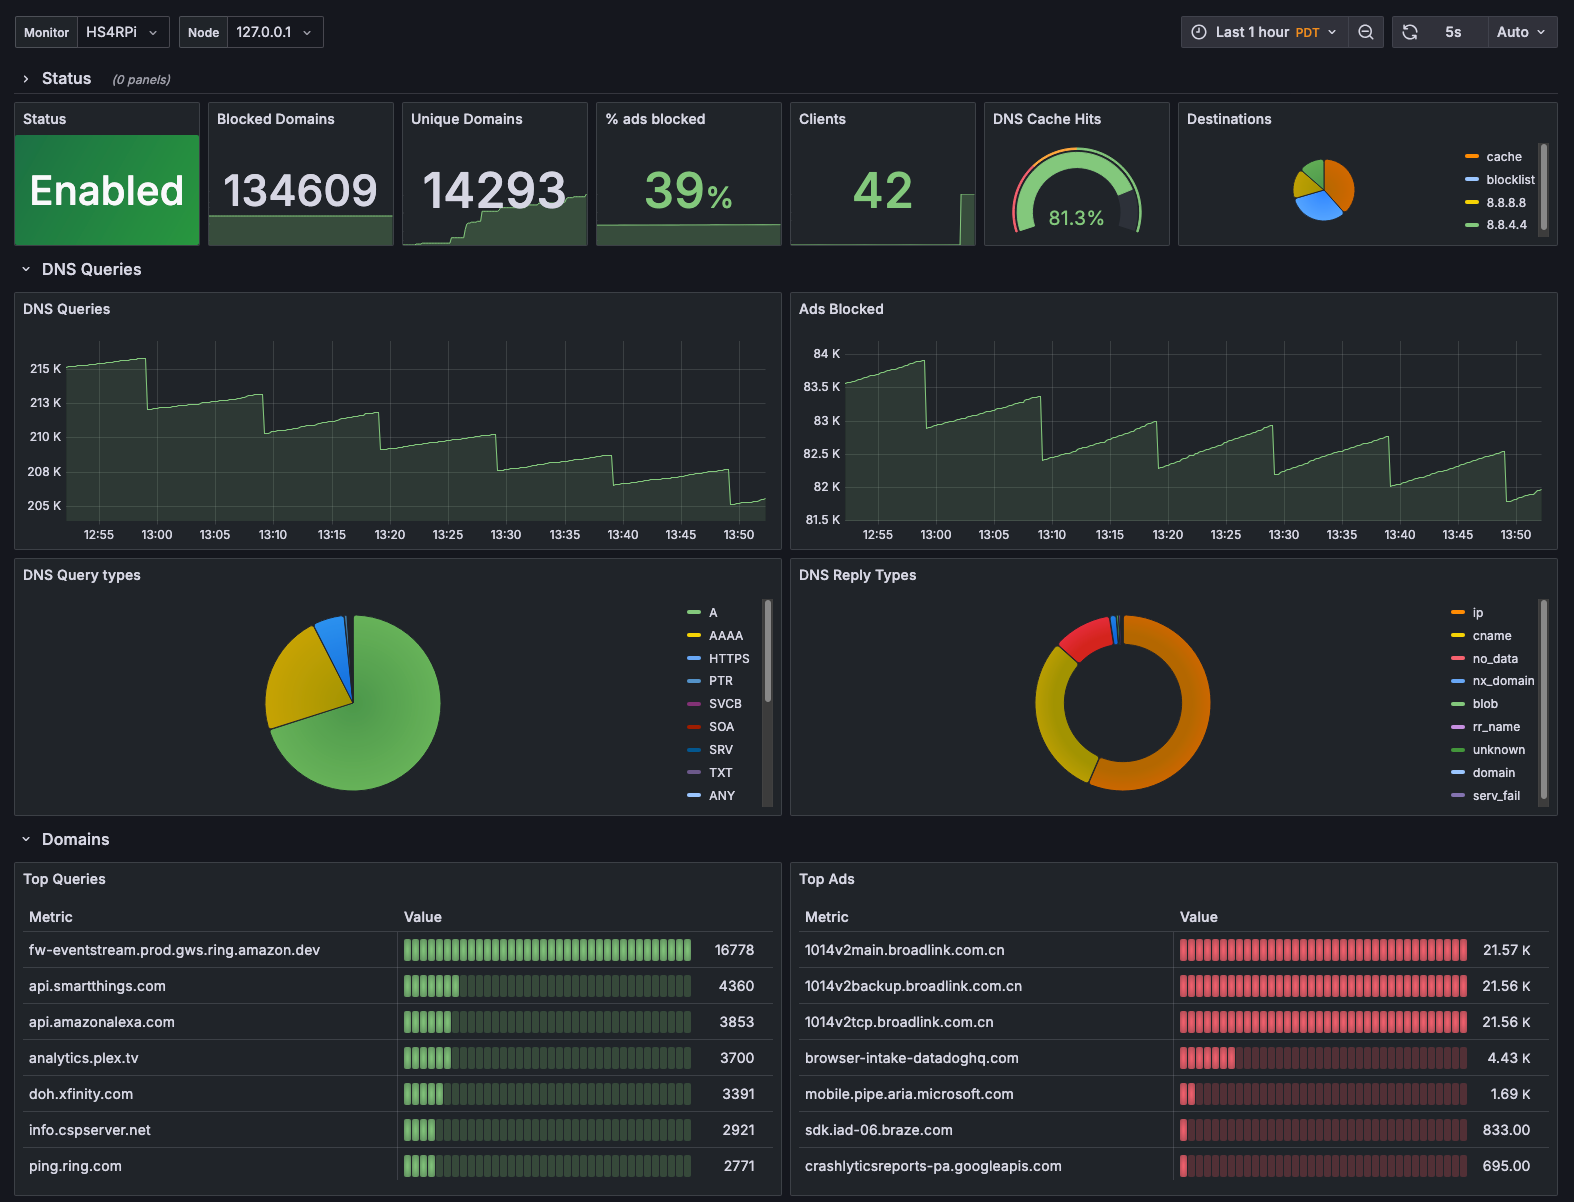
First, let's review our final destination. I've based the steps on this guide to achieve a setup identical to what I have running in my own home-lab:
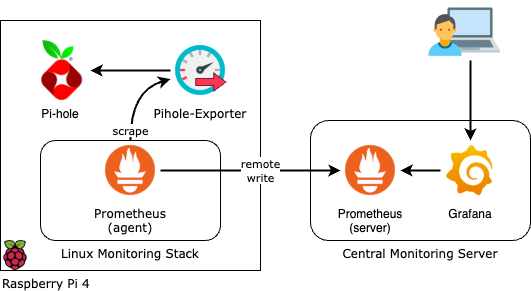
Since I built my system using the guides linked in the previous section:
- I have Pi-hole running as a Docker container with host network mode.
- I have Prometheus agent running as a Docker container in the same node as Pi-hole, writing metrics remotely to a central monitoring server.
If your setup is different than mine, you may need to make a few adjustments to some of the following steps. For example, if you are running Pi-hole in a macvlan network, you may need to change the hostname configuration in pihole-exporter to point to the IP address assigned to the Pi-hole container.
[!tip] If you run into trouble, feel free to drop me a note in the comments section, at the end of the article.
Step 1: Deploy the Pi-hole Exporter Container
Make sure that you have configured the Application Templates in Portainer to use the repository of templates available in our Github repository. Follow this link for instructions on how to do this.
- Log into your Portainer Server admin website.
- Open the Environment for your Pi-hole server.
- Click on Templates from the right-side menu.
- Select the Pi-hole Exporter template from the list.
- Under Configuration:
- For Network, select host.
- For Pi-hole Password, enter the same password you used when configuring your Pi-hole container. This is the password you use to log into your Pi-hole's admin website.
- Click on Deploy the container.
Once deployed, you can navigate to the Containers view in Portainer, then click on the pihole-exporter container. The Container status should show the container as running. If you click on Logs at the bottom of Container status, you should see a note at the end, like this:
time="2025-03-26T16:22:07Z" level=info msg="Starting HTTP server"You should also be able to view the raw metrics by pointing your browser to the following address: http://<pihole_node_ip>:9617/metrics
Step 2: Scrape the Metrics With Prometheus
Now that we know the metrics are available to be scraped, we need to change the configuration in Prometheus to grab them from pihole-exporter.
- Open the configuration file for Prometheus. Use your favorite editor (nano is a good option). You will need to use sudo because the file is owned by the user that Prometheus runs under.
sudo nano /srv/appdata/linux-monitoring-agent/prometheus/prometheus.yml- Add a new job called
pi-holeunder the existing sectionscrape_configs. Since we set our exporter to run in host network mode, we need to use the aliashost.docker.internalwhich resolves to the IP of the docker network gateway.
scrape_configs:
  - job_name: pi-hole
  - static_configs:
- targets: ['host.docker.internal:9617']- Restart the prometheus container running on the Pi-hole node. You can do this from Portainer by opening the Containers section, click on the prometheus container and use the Restart button in the Actions panel at the top.
Step 3: Create a Dashboard for Pi-hole in Grafana
Now that we have configured Prometheus agent to scrape metrics from pihole-exporter, the metrics should be flowing to our central Prometheus server, and available to consume from Grafana. The last step to complete our setup is to visualize these metrics with a dashboard.
- Log into your Grafana admin website.
- Open the Dashboards section from the left-side menu.
- Click on the New button.
- In the drop-down menu that shows, select Import.
- Open the following file on a new tab: pi-hole.json
- Copy the entire content of the file into the JSON model textbox in Grafana.
- In the screen that follows, select your prometheus data source and,
- Hit the Import button.
What's Next?
With pihole-exporter feeding data into Prometheus and Grafana, you’ve got a solid monitoring foundation for your Pi-hole setup. From here, you can:
- Tune your dashboards — Add panels for query types, client activity, or time-of-day trends to better understand usage patterns.
- Set up alerts — Use Grafana alerting rules to notify you of unusual behavior, like sudden spikes in DNS queries or a drop in block rates.