Monitoring your Linux server in real-time is crucial to keep it running smoothly and to react quickly at the first sign of an issue, thus preventing potential failures. Whether your server is running software for home automation, media streaming, or other self-hosted solutions, tracking key metrics like CPU usage, memory consumption, disk health, and running processes gives you better control over system performance. Rather than opportunistically checking logs or inspecting instant CPU/RAM metrics, having access to detailed historical data gives you a deeper insight into your system behavior.
In this guide, we’ll set up Prometheus and Grafana—two powerful open-source tools—to visualize your server’s health at a glance. By deploying everything via Docker, we ensure an easy, portable, and reproducible setup. We’ll also use various exporters to gather system metrics, allowing you to track everything from CPU load to disk health in one sleek dashboard. Let’s dive in and build a real-time monitoring solution that keeps you informed at all times!
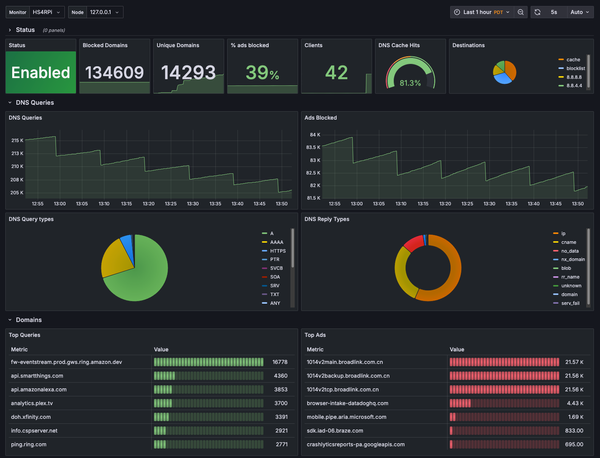
Do you want to take a peek at what our final monitoring solution will look like? Follow this link to try out an interactive version of one of the dashboards we will be setting up, populated with real-world serer metrics.
The Components of Our Monitoring Stack
There are multiple alternatives available to build a monitoring stack for servers running on Linux. For this guide we have chosen a solution built on software components that are popular, easy to configure and deploy, and provide good scalability for our future self-hosting needs.
Prometheus: The Core of Monitoring
Prometheus is an open-source monitoring and alerting toolkit designed for collecting and storing time-series metrics. Most important to our guide are its ability to scrape metrics from services using HTTP requests at regular intervals, and storing them in its own time-series database (TSDB). Prometheus is highly scalable, supports multi-dimensional data, and comes with a flexible query language (PromQL) to analyze metrics effectively. In this guide, we’ll use Prometheus to collect and store system metrics using various exporters.
Grafana: Visualizing Metrics in Real-Time
Grafana is an open-source analytics and visualization tool that connects to Prometheus (and other data sources) to provide interactive dashboards. With Grafana, you can create customizable graphs, set up alerts, and gain deeper insights into system performance. We’ll configure Grafana to display real-time data from our Prometheus setup, making it easy to monitor CPU load, memory usage, storage health, and more in a single, user-friendly interface.
Data Exporters: Collecting System Metrics
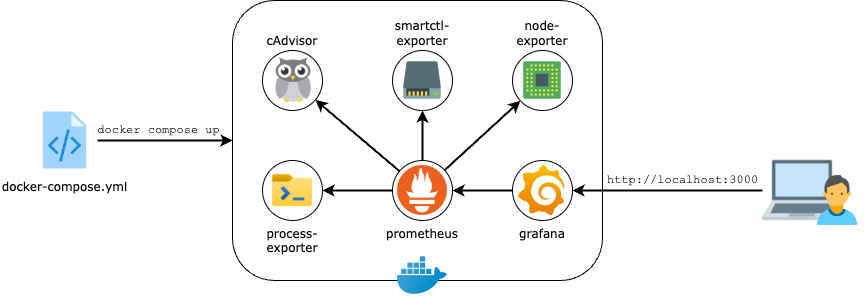
To gather detailed metrics from the server, we’ll use a set of Prometheus exporters—each designed to collect specific types of data. Node Exporter will provide essential system metrics like CPU, memory, and disk usage. Process Exporter will allow us to monitor specific processes running on the system. Smartctl Exporter will retrieve SMART data from storage devices to track disk health and prevent failures. Finally, cAdvisor (Container Advisor) will collect resource usage statistics for running containers, making it invaluable for Docker-based environments. These exporters will work together to provide a comprehensive view of your system’s performance.
What We Need Before Getting Started
We will be using Docker to deploy and manage our monitoring stack. We will also be using Portainer to speed up the configuration and deployment steps. Make sure you have followed the steps in both of the relevant guides, linked below. In particular, make sure that you configure your application data directory according to the guide:

Deploying Our Monitoring Stack
In this section we are going to stand up all the services that form our monitoring stack. We will be using Portainer to deploy our monitoring stack using its friendly Web UI.
If you prefer to deploy using the CLI, follow the steps described in the section: Deployment With Docker Compose at the end of this article, then come back to continue with the guide.
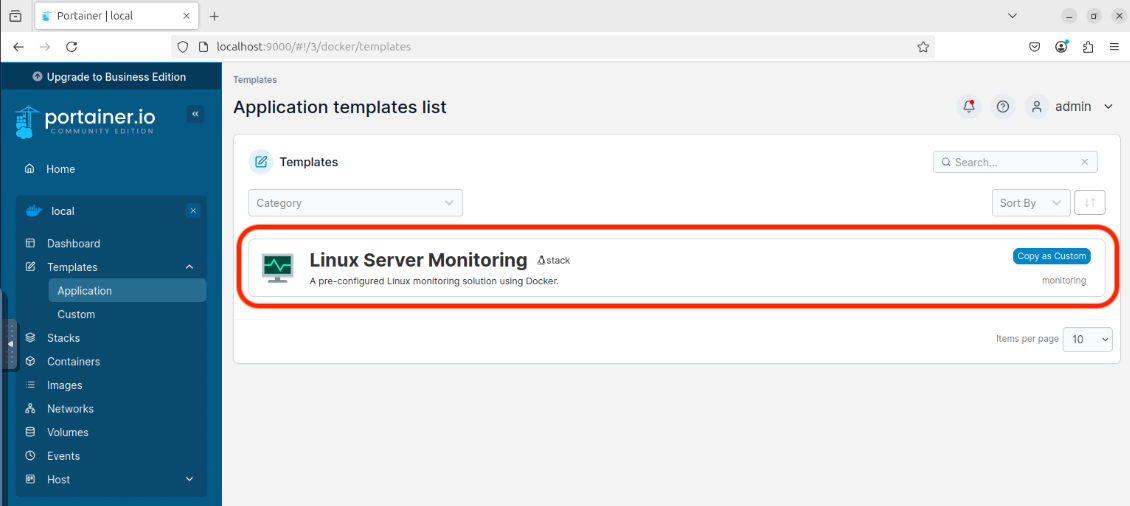
- Open your server environment in Portainer (usually local) and select the meny option Templates > Application. In the list of templates, choose the one for Linux Server Monitoring. If you don't see the template in the list, make sure you have configured the app template location in Portainer
- From a terminal window on the server being deployed to, run the command that shows under the Information section of the template. This will setup the application data for all the containers within the stack.
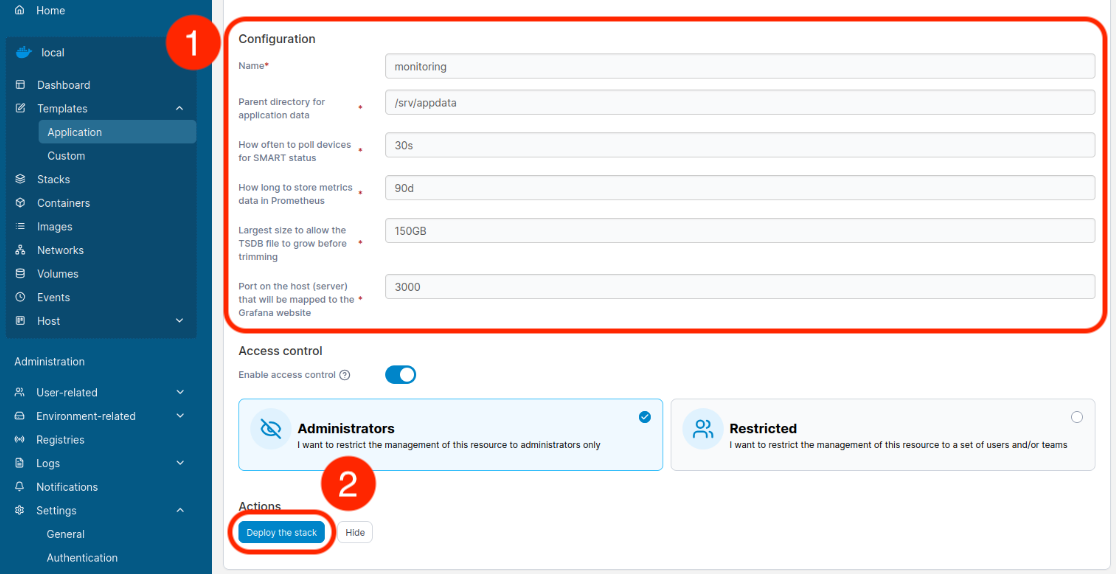
- Under Configuration, enter a name for your stack (e.g. monitoring), review the rest of the settings, and hit Deploy the stack.
That's it! Our monitoring stack should now be up and running, collecting metrics from our system. The last step is to set up Grafana and create some dashboards! 🚀
Setup The Dashboards In Grafana
Now that our stack is up and running, we need to create some dashboards that feed from the metrics that are being scraped and stored into Prometheus' time-series database.
Step 1: Sign-in To Grafana
The Grafana service should be up and running on our server, and it should be listening for connections on port 3000 (unless you set a different value in the template configuration in Portainer). So we can now open a web browser and point it to the Grafana web portal. If your server has a graphic logon (e.g. Ubuntu Desktop) you can launch Firefox on the server itself and open http://localhost:3000. If your server is headless, you'll need to do this from another computer on the same network and point it to your http://your_server_ip:3000.
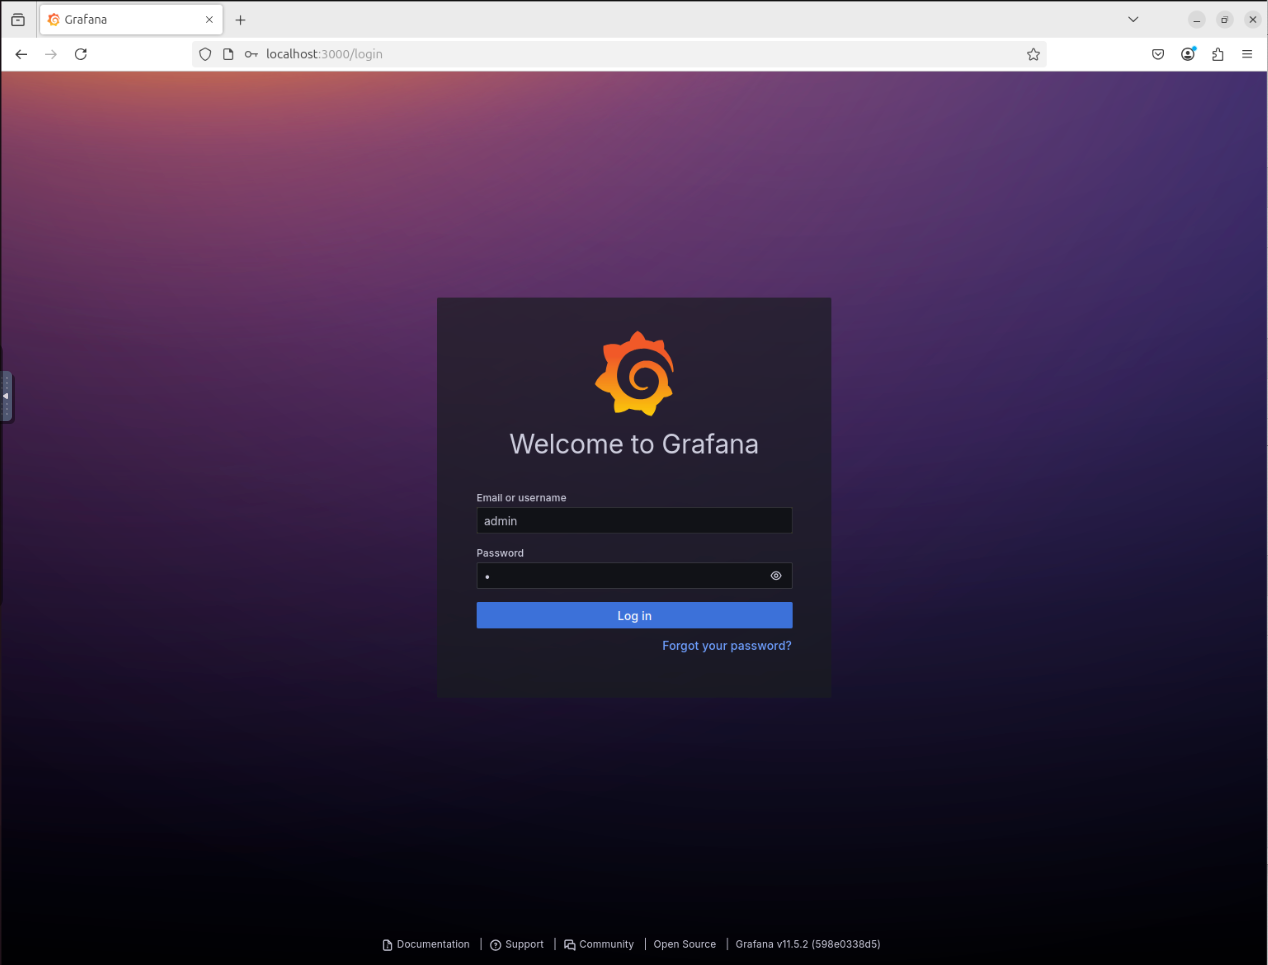
The first time that we launch Grafana after setting up our stack, we can login with the default username admin and password admin. You will be immediately asked to change the administrator password—choose a strong password and write it down somewhere safe (ideally a password manager, such as 1Password).
Step 2: Download And Import Sample Dashboards
I've curated a set of dashboards that will help us jump-start our Grafana server with useful visualizations that leverage all the metrics exporters that we just deployed using Docker. To set them up, download them using the links below:
File |
Use-case |
|---|---|
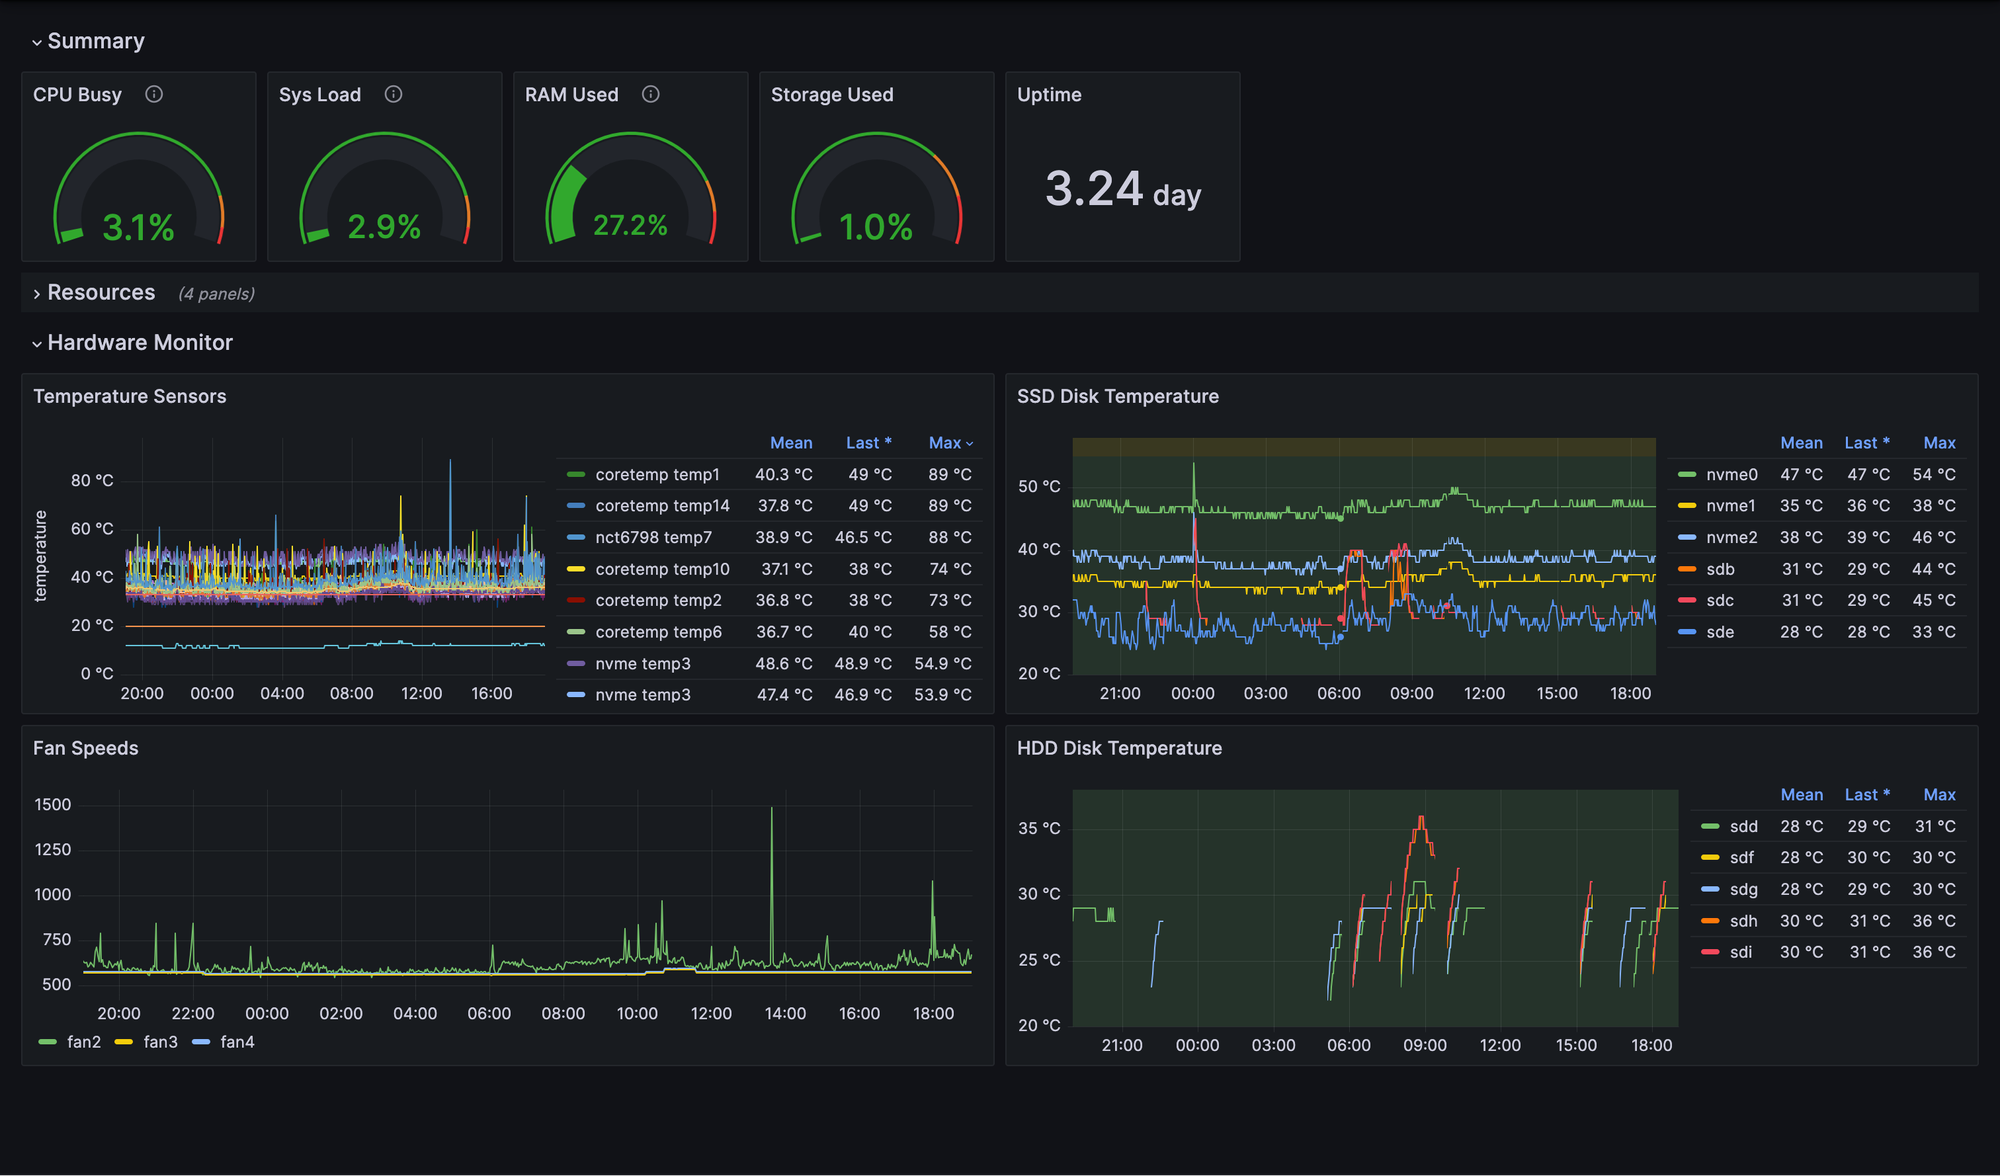
| linux.json (example) | Primary dashboard, with a mix of high-level metrics for a Linux server |
| docker.json (example) | Shows resource usage of docker containers running in the server |
| processes.json (example) | Shows resource usage by individual processes running on the server |
| storage.json (example) | Shows details about mount points and devices (HDD, SDD and NVME) |
| prometheus.json (example) | Shows details about the performance of the Prometheus service itself |
For each of the files on the table above, take the following steps in your Grafana Web UI:
- Open the Dashboards section from the left-side menu.
- Click on the New button.
- In the drop-down menu that shows, select Import.
- Click on the file link from the table above to open the raw dashboard (json).
- Copy the entire file content into the JSON model textbox in the Grafana page.
- In the screen that follows, select our prometheus data source and,
- Finally, hit the Import button.
Step 3: Start Using The New Dashboards! 🎉
From the dashboards we just imported, the one called Linux is meant to be used as a starting point. At the top of this dashboard we will find 2 groups of links, under Systems and Applications. These links will navigate to the more detailed dashboards, while maintaining the current values for variables and time-ranges.
Tweaking Our Stack Configuration (Optional)
Eventually, we may need to make some changes to the configuration on our monitoring services. Here are a few examples, and the location where you will need to make those changes:
- Change the retention policy for Prometheus data. If we want to keep more or less data than the default (90 days or 150GB) we can make this change using Portainer. Open the stack (Stacks > monitoring), switch to the Editor tab and expand the Environment variables section. Make the necessary changes and then hit Update the stack.
- Include additional scrape jobs in Prometheus. If we want to include metrics for additional services in our home lab (e.g. HomeSeer) we need to add their information to our Prometheus configuration. This is specified in
/srv/appdata/prometheus/prometheus.ymlbut the specific changes are dependent on the service we need to include. - Fine tuning the amount of information collected from running processes. By default, process-exporter will be collecting information from every process running in our server. We may need to adjust the configuration to exclude some or only capture information about a specific subset of processes. This is specified in
/srv/appdata/process-exporter/config.yml
What's Next?
Now that we have a functional monitoring stack running with Docker, there's more advanced things we can do that leverage our setup. Here's a few ideas to get you started:
- You can build upon what we learned while setting up Direct Access for HomeSeer and use Tailscale to access your Grafana dashboards securely from anywhere in the world, using your phone, tablet or laptop.
- If you already host another web service, or want to host multiple additional services alongside Grafana, you can setup a reverse proxy like Traefik (also using Docker!)
- You can use the Prometheus and Grafana that we just setup to scrape device metrics from HomeSeer and gain useful insights on your Smart Home setup. A guide on this will be coming shortly!
Alternative: Deployment With Docker Compose
In this section we will deploy the monitoring stack using Docker Compose. Only follow these steps if you chose not to use Portainer.
Step 1: Setup your deployment workspace
mkdir -p ~/compose/monitoring
cd ~/compose/monitoring

wget https://raw.githubusercontent.com/thedebuggedlife/portainer-templates/refs/heads/main/linux-monitoring/docker-compose.yml

wget https://raw.githubusercontent.com/thedebuggedlife/portainer-templates/refs/heads/main/linux-monitoring/.env
Step 2: Review the deployment configuration
Now, open the file ~/compose/monitoring/.env with your favorite text editor and make any necessary changes to the variables in the file:
Variable |
Default |
Purpose |
|---|---|---|
APPDATA_LOCATION |
/srv/appdata/linux-monitoring |
Path to appdata location |
SMARTCTL_INTERVAL |
30s |
How often to poll devices for SMART status |
PROMETHEUS_RETENTION_TIME |
90d |
How long to store metrics data in Prometheus |
PROMETHEUS_RETENTION_SIZE |
150GB |
Largest size to allow the TSDB file to grow before trimming |
GRAFANA_WEB_PORT |
3000 |
Port on the host (server) that will be mapped to the Grafana website |
Step 3: Setup the application data folder
We need to create the application data folders that will be used by the different containers in the stack:
wget -qO- https://raw.githubusercontent.com/thedebuggedlife/portainer-templates/refs/heads/main/linux-monitoring/setup.sh | bashStep 4: Deploy the stack
Last, we use Docker Compose to create the stack:
# Go back to our workspace
cd ~/compose/monitoring

# Launch our stack (detached)
sudo docker compose up -d
Now we sit back and wait for Docker to work its magic. Once the last command completes, all the services on our stack will be up and running.