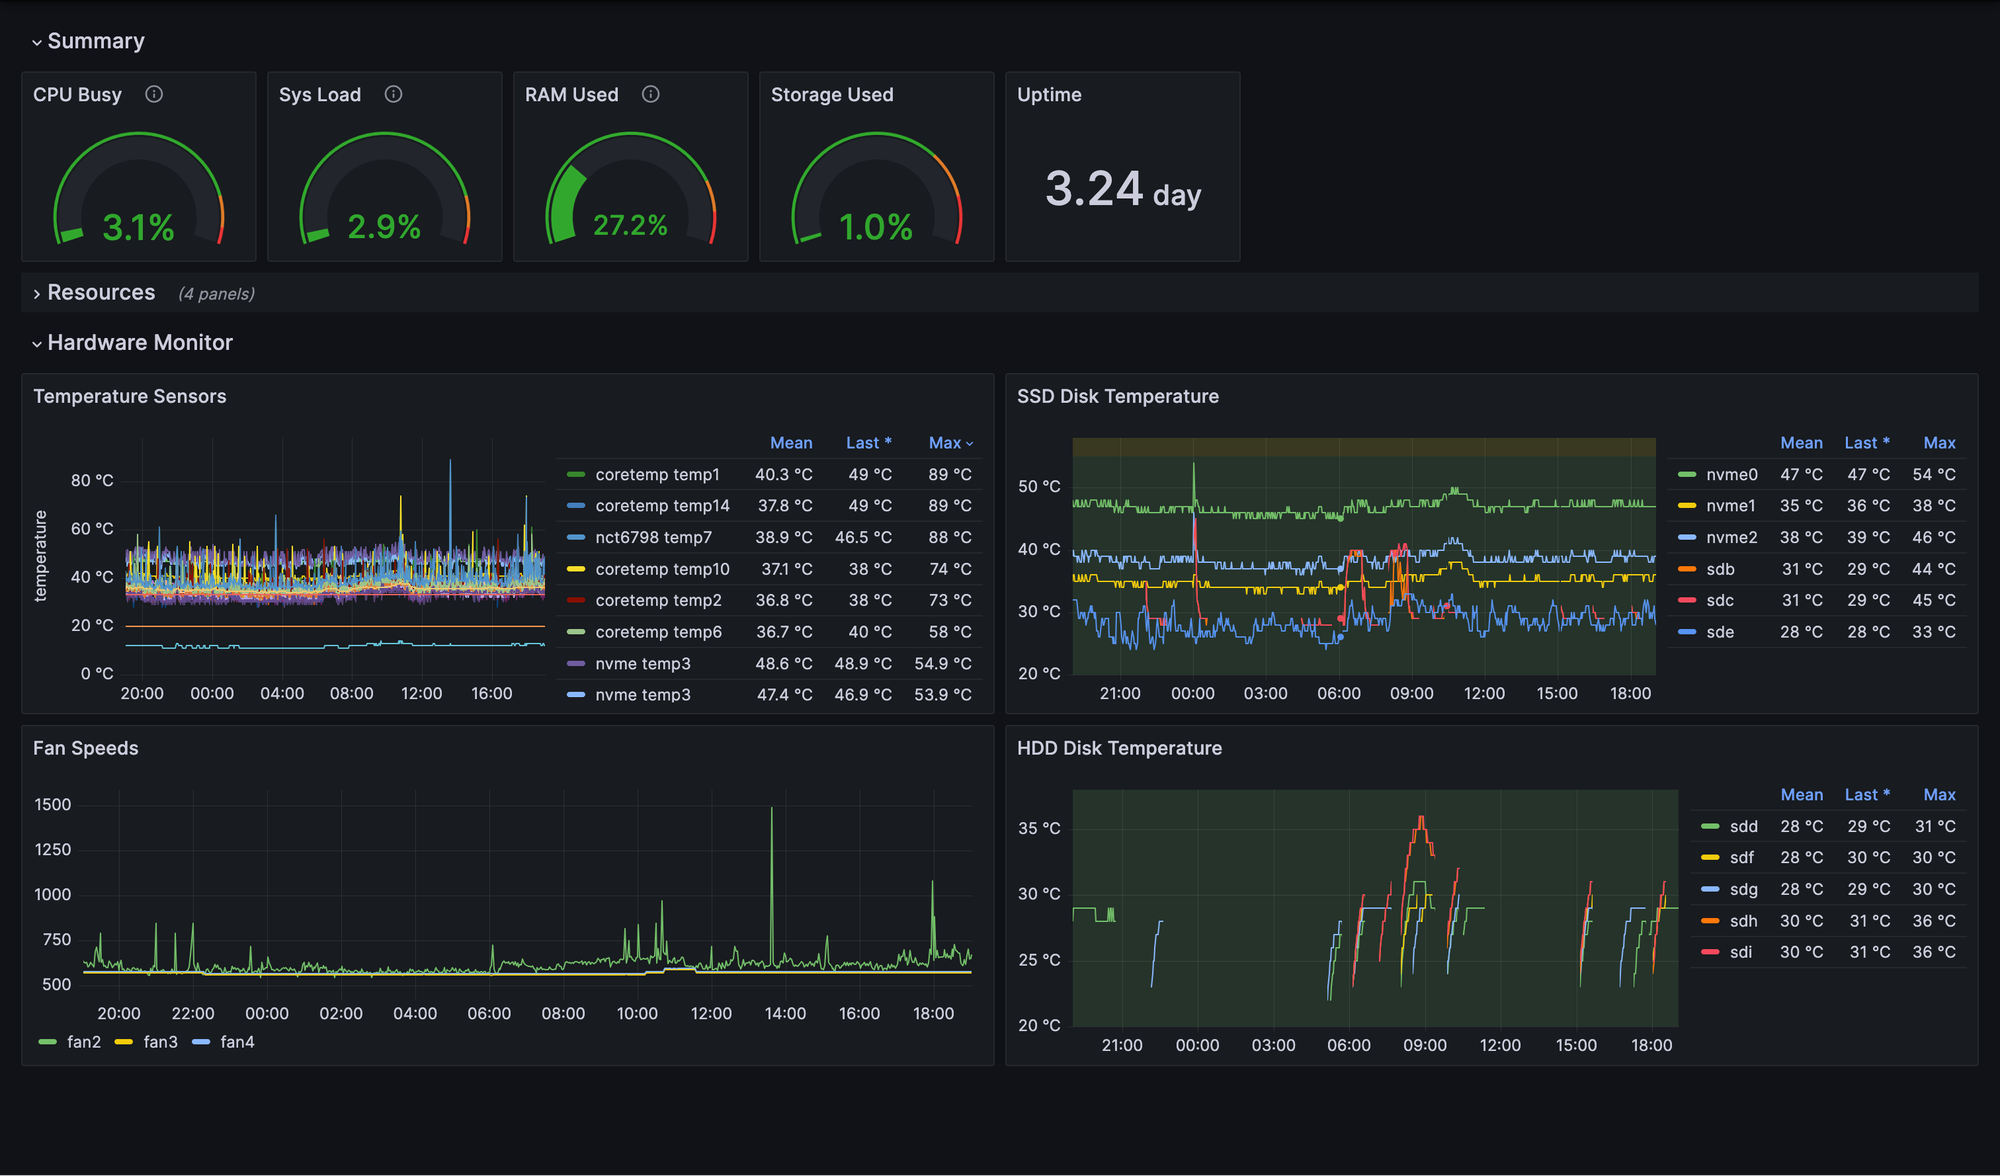
In a recent article, we explored how to monitor a home server using Prometheus and Grafana. This all-in-one setup allowed us to track key resource metrics—CPU, memory, disk usage, running processes, and Docker containers—while visualizing them in real-time dashboards. It’s a great solution for a single-server environment, but what happens when our home lab grows to multiple machines? How can we scale our monitoring setup while keeping it efficient and manageable? Naturally, we want to continue using Grafana for visualization and Prometheus as our time-series database, but a traditional approach where a central Prometheus instance scrapes metrics from all nodes can introduce performance bottlenecks.
A more efficient solution is leveraging Prometheus in “agent” mode. In this configuration, each monitored server runs a lightweight Prometheus instance that scrapes local metrics and forwards them to a central Prometheus server via remote write. Since these agents do not store long-term data, they require significantly less storage, reducing overhead on individual machines while optimizing network usage. This architecture provides a scalable and resource-efficient way to monitor multiple machines in a home lab or production environment.
By the end of this guide, we’ll have a fully functional monitoring stack with the following components:
- A central Prometheus server with sufficient storage to retain time-series data for all monitored servers.
- A single Grafana instance pulling and visualizing data from the central Prometheus server.
- Metrics exporters running on each monitored machine to collect system performance data (CPU, memory, disk, etc.).
- A Prometheus agent on each monitored server, scraping local metrics and performing remote writes to the central Prometheus instance.
What We Need Before Getting Started
Docker Installed in Each Monitored Server
Before we dive into the setup, let’s ensure we have everything in place. Our entire monitoring stack—metrics exporters, Prometheus, and Grafana—will be running in Docker containers. That means we need Docker installed on each monitored machine as well as on the central collection server. If you haven’t set up Docker yet, refer to Docker Setup and Storage Management for steps on how to do this.
Portainer Server and Portainer Agent Configured
To simplify container management across multiple servers, we’ll also be using Portainer. Portainer provides a centralized dashboard to deploy and manage Docker containers effortlessly. Before proceeding, make sure:
- Portainer Server is installed and configured on your central management machine. Check out the guide Simple Container Management With Portainer if you need help with the steps.
- Portainer Agent is running on each monitored server. Check out the guide Portainer Agent: Managing Containers Across Servers if you need help with the steps.
Quick Overview: Prometheus in Agent Mode
Following the steps on this guide, we are going to run Prometheus in Agent Mode on each server we want to monitor. These agents will collect local metrics and forward them via remote write to a central Prometheus instance, which will be running in its standard server mode to store and process the data. The final setup will look like this:

But before setting up our monitoring system, let’s take a quick look at Prometheus Agent Mode and how it differs from the standard server mode.
Prometheus in Normal Mode
In its traditional mode, Prometheus operates as a scraping and storage system:
- It pulls metrics from exporters running on various machines.
- It stores time-series data locally (or in long-term storage if configured).
- It processes queries for Grafana or other consumers.
While this approach works well for small setups, it can become resource-intensive when scaling to multiple servers. A single Prometheus instance scraping dozens (or hundreds) of targets can lead to high memory usage, network congestion, and storage demands.
What is Agent Mode?
Prometheus Agent Mode is a lightweight alternative introduced to address scalability challenges. Instead of acting as a full-fledged monitoring server, the agent focuses only on:
- Scraping metrics from local exporters.
- Temporarily buffering data until it is successfully sent.
- Forwarding metrics via remote write to a central Prometheus instance.
Unlike normal mode, an agent does not store or query time-series data—it simply collects and forwards, reducing storage, CPU, and memory usage on individual nodes.
A Note on Disk Usage
It’s important to note that even though Agent Mode does not store data in the TSDB (time-series DB), Prometheus still relies on the Write-Ahead Log (WAL) to temporarily buffer metric data on the remote node. By default, the WAL is stored to disk. In the deployment configuration used by this guide, the WAL is stored in a folder under /srv/appdata.
Using the WAL and persisting it to disk ensures reliability by allowing agents to retain data during short outages of the central Prometheus server, such as during scheduled maintenance. It also makes the agents resilient to unplanned restarts because the WAL remains available until the next time the agent container starts.
Step by step guide
Step One: Deploy the Central Monitoring Server
In our central server we will be running Prometheus in regular server mode, as well as Grafana. The following guide provides all the information you need to complete this step:

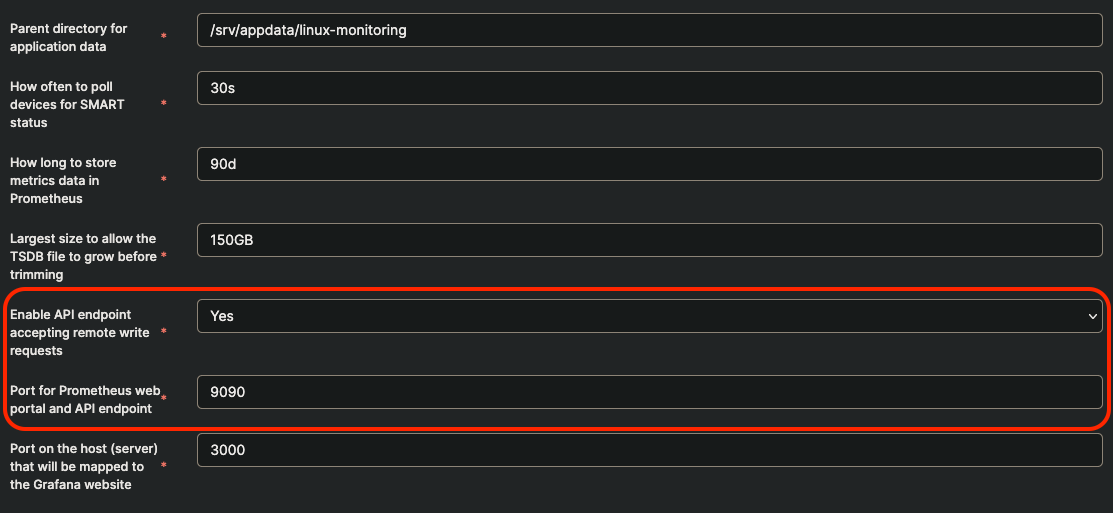
When following the steps of the guide above, in the configuration of the Linux Server Monitoring template, make sure to set the following template environment variables as follows:

Only if you had already deployed the central monitoring server without changing these settings in the template, do the following, using Portainer Web UI:
- Navigate to the details for the prometheus container under the environment for your central monitoring server
- Click on the Duplicate/Edit button at the top.
- In the Advanced container settings make sure the following option is included in the Command textbox:
'--web.enable-remote-write-receiver=true' - Under Port mapping make sure there is a mapping for Container port 9090 to Host port 9090. If not, add it by using the Map additional port button.
- Click on Deploy the container and confirm you want to Replace the container in the pop-up that follows.
Step Two: Deploy Each Remote Server Stack
For each of the remote servers we want to monitor, we need to deploy the metrics exporters as well as Prometheus configured to scrape their metrics and perform a remote write to the central Prometheus server.
Make sure you have configured the App Template Location in your Portainer Server Web UI, and set it to point to our Github repository, as explained on Step 3 of the Portainer Server Guide.
- From the Home dashboard of the Portainer Server Web UI, locate the environment (server) you want to deploy the monitoring agent stack.
- On the right-side menu, navigate to Application under Templates and select the Linux Server Monitoring (Agent) template. Pick the arm|arm64 version if you are deploying the agent to a Raspberry Pi node.
- Follow the instructions that show up at the top of the template definition to setup the application data folder required by the stack.
- The setup script will ask for the address of the central Prometheus server
- Give the stack a name and review the value of the template variables (the defaults should work OK in most cases).
- Click on Deploy the stack.
Step Three: Verify Metrics Are Available for Every Server
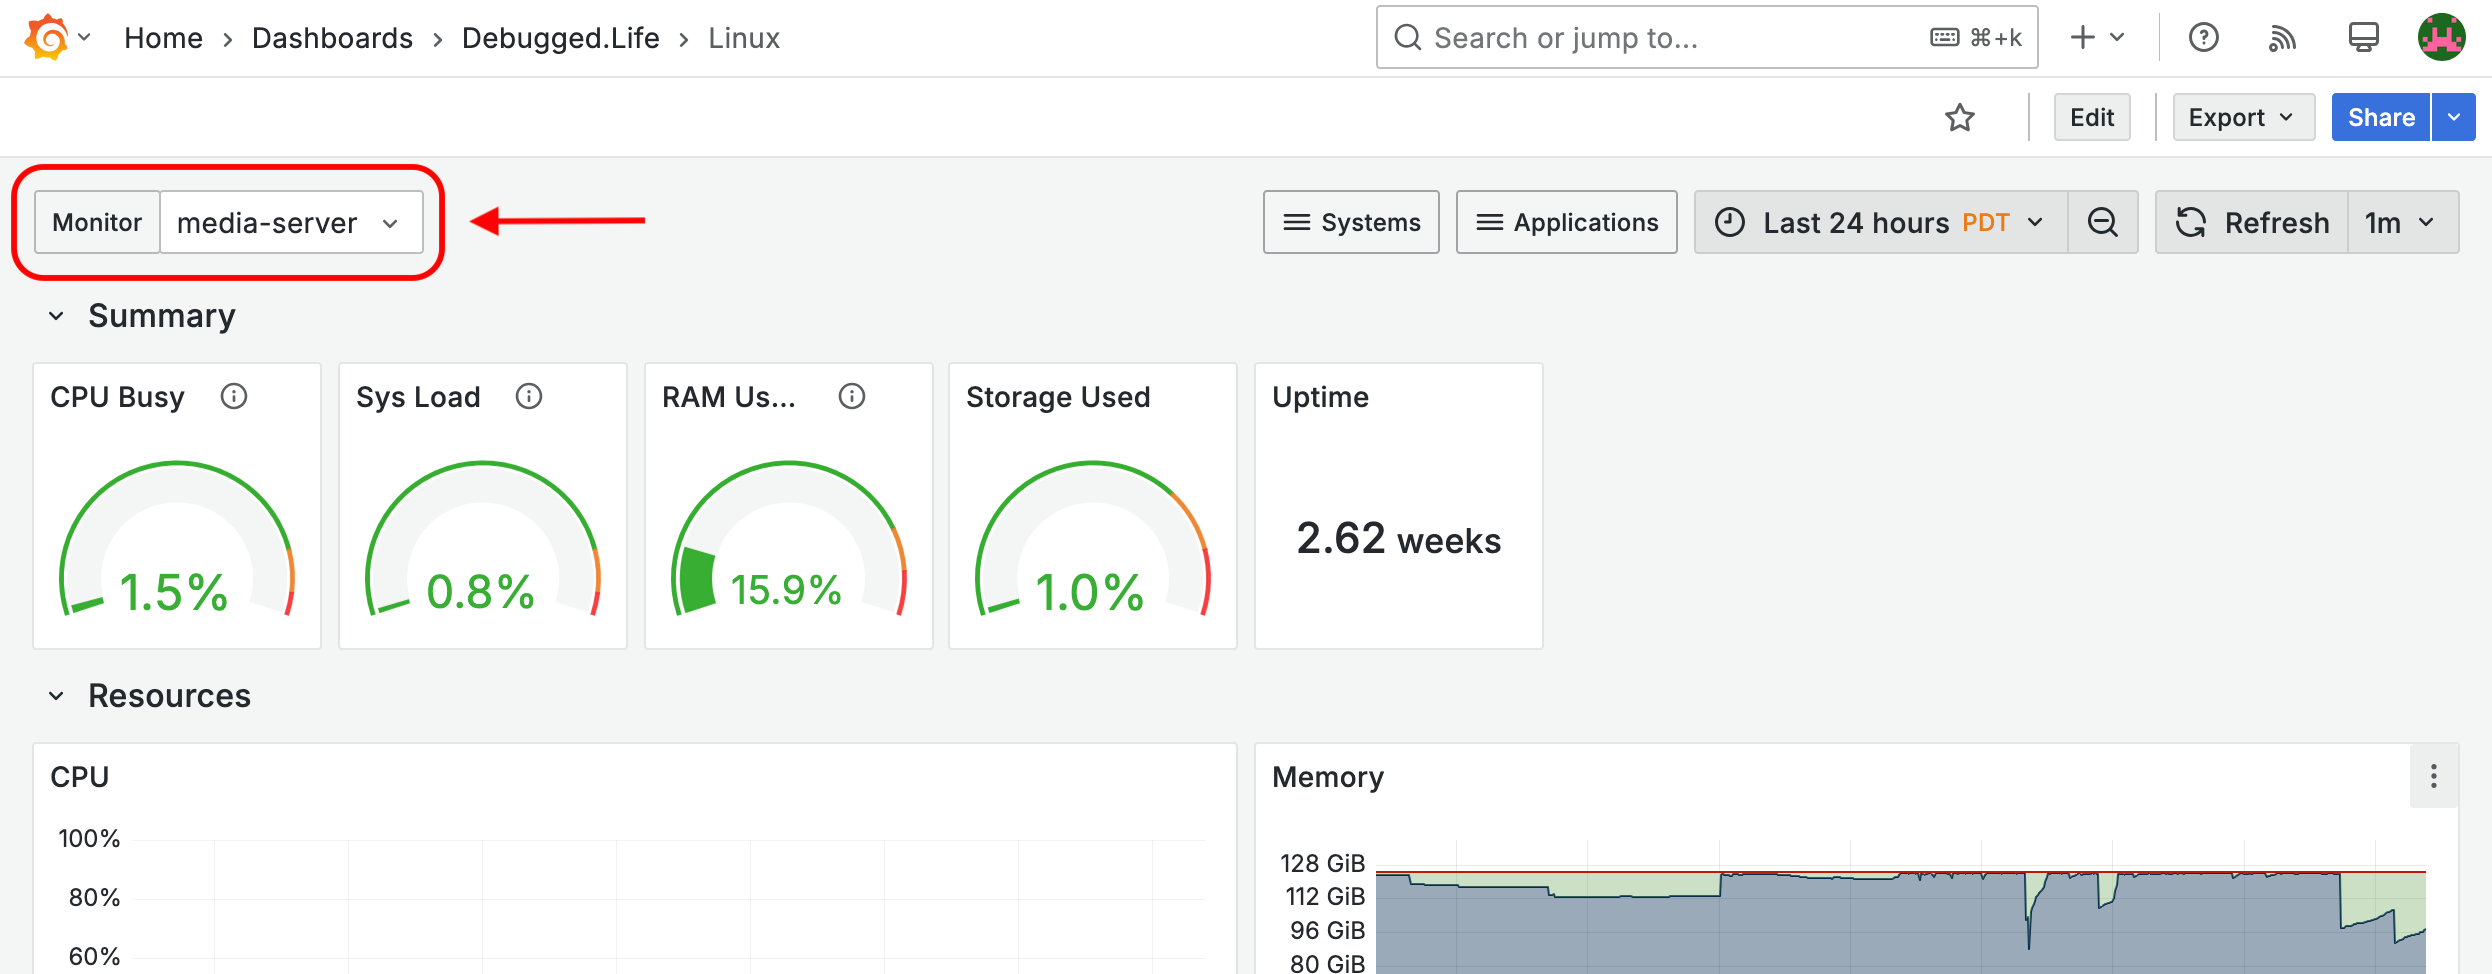
If you followed the step to Download and Import the Sample Dashboards to your Grafana server, you should be able to select the server that you want to monitor directly from the dashboard. Open the drop-down menu called Monitor at the top-left corner of the dashboard and select the name of the server you want to monitor.

Alternatively, you can use Grafana's Metrics Explorer to check if the metrics from your remote servers are available in Prometheus. Log into your Grafana Web UI and then:
- Open the left-side menu and select Explore.
- Make sure the right data source is selected (Prometheus).
- In the query box, enter a metrics generated by any of the exporters configured on the remote server. For example, if you are using node-exporter to collect CPU metrics, enter the following
sum(node_cpu_seconds_total) by (monitor) - Hit the Run Query button. You should see the names of all the known servers in the query results shown in the lower panel.
What's Next?
Now that you’ve successfully deployed Prometheus in Agent Mode across your servers, you have a centralized monitoring system that efficiently collects and visualizes metrics in a single Grafana dashboard. This setup allows you to monitor multiple machines and simplify dashboard design by consolidating data from various sources.
But there’s still plenty of room for improvement and expansion! Here are some next steps you can take to enhance your monitoring stack:
- Monitor Additional Services – Extend your setup by collecting metrics from self-hosted services like databases (PostgreSQL, MySQL), web servers (NGINX, Apache), and application workloads. Use service-specific exporters (e.g., postgres_exporter, nginx-vts-exporter).
- Set Up Alerting with Grafana – Create alerts to receive notifications via email, or push notifications when critical metrics exceed thresholds (e.g., high CPU usage, disk space nearing capacity). And since all servers on your network publish metrics to a central monitoring stack, you can set a single alert that monitors the same metric (e.g. CPU utilization) across all servers.
- Visualize Logs Alongside Metrics – Combine metrics and logs in Grafana Loki, allowing you to correlate log events with performance anomalies.


