When monitoring HomeSeer on a Linux system using process-exporter, you may have noticed that all HomeSeer-related processes appear under the generic name "mono". This is because, on Linux, HomeSeer uses mono as the .NET Framework runtime. This makes it difficult to track the performance and resource usage of the HSConsole and its various plugins individually.
To fix this, we need to configure process-exporter to extract the actual command-line arguments used when launching HomeSeer and its plugins. This allows Prometheus to display meaningful process names, making it easier to monitor and troubleshoot HomeSeer’s components.
Do you want to know more about process-exporter, how it fits on a monitoring stack with Prometheus and Grafana? Check out the article Real-Time Server Monitoring with Prometheus and Grafana
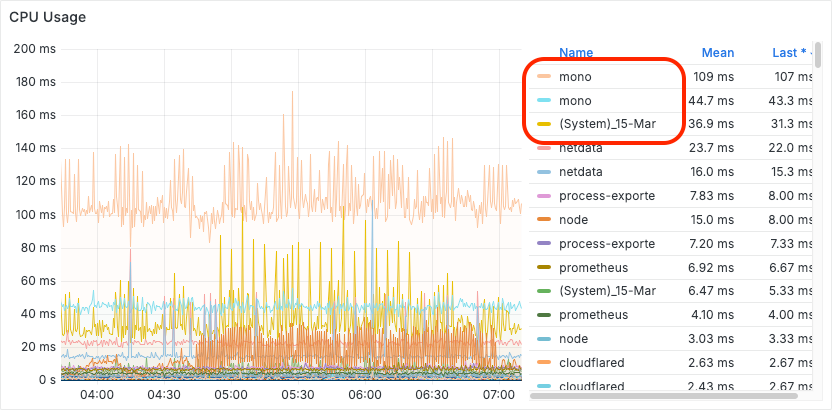
After applying this fix, our process-exporter dashboard in Grafana will go from looking like this:
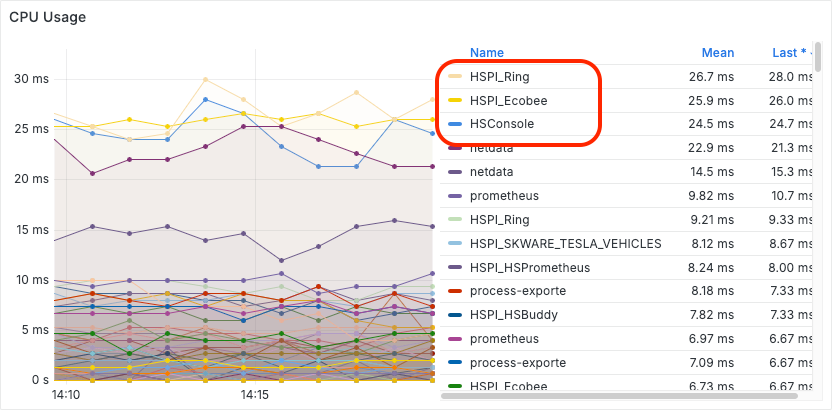
To something that is a lot more useful and easier to understand, like this:
Applying the Fix: Configuring process-exporter
To make our process-exporter dashboard show the proper process name for HomeSeer and its plug-ins, we will need to make a change to our process-exporter configuration.
Locate the configuration file for process-exporter. If you setup your monitoring stack using the guides available on this site (like Real-Time Server Monitoring with Prometheus and Grafana), your process-exporter configuration file should be located either at: /srv/appdata/linux-monitoring/process-exporter/config.yml or /srv/appdata/linux-monitoring-agent/process-exporter/config.yml.
Add a process renaming rule to the configuration file. Modify the configuration file to look like the following. If you have made changes previously to this configuration file, you want to grab the special rule for mono processes (first one shown below) and copy it at the top of the rules on your own configuration file:
process_names:
  # Special rule for mono processes
  - name: "{{.Matches.Binary}}"
    exe:
    - mono
    cmdline:
    - '^(?:.*\/)?mono\s+(?:.*\/)?(?P<Binary>\w+)'
  # Default rule for all other processes
  - name: "{{.Comm}}"
    cmdline:
    - '.+'
Restart the process-exporter container. You can do this from a terminal running sudo docker restart process-exporter or by locating the container in Portainer and using the Restart button from the button bar at the top.
Understanding the Configuration Changes
It will be useful to understand exactly how the new process-exporter rule works, in case you want to add more rules for different use-cases in the future. Here is a break-down of the configuration changes we made.
In case you're curious, the syntax we are using below to describe each change is called JSONPath.
process_names[0].exe[0]
First we filter processes to only those where the executable base-name is "mono". This helps reduce CPU overhead by limiting the regular expression evaluation to only relevant processes.
process_names[0].cmdline[0]
Next, we define a regular expression to parse the command line of each process. Our regular expression has a capture group called Binary that contains the name of the EXE that was invoked using mono.
process_names[0].name
Last, we set the name of the process group to the value retrieved by the Binary capture group in the regular expression.
What's Next?
You can use this same process of defining additional rules on your process-exporter configuration file to improve readability of your Grafana dashboards for additional use-cases. This same approach is useful for other process-wrappers or script-evaluation frameworks like python, node, java, etc.
If you need to understand the syntax of the process-exporter configuration file better, check out the documentation available in their Github repository.