As we discussed in the article Scalable Server Monitoring With Prometheus, even when running in Agent Mode, Prometheus maintains a Write-Ahead Log (WAL) to temporarily store metrics before forwarding them to the central Prometheus server. While this buffering improves reliability, it can be a concern for systems using storage with lower write endurance, such as SD cards instead of SSDs, NVMe drives, or even traditional HDDs.
To reduce disk writes, we can take advantage of Docker’s tmpfs mounts, which store data entirely in memory rather than writing to disk. According to Docker’s documentation:
“A tmpfs mount is temporary and only persists in the host memory. When the container stops, the tmpfs mount is removed, and files written there won’t be persisted.”
For Prometheus Agent, using a tmpfs mount means that all WAL data will be stored only in RAM, eliminating disk writes entirely. However, this comes with some important trade-offs:
- The tmpfs mount uses RAM as storage, meaning it will reduce the amount of RAM available to other processes running on the server running the Prometheus Agent. Since the data in the WAL is only needed to buffer remote writes to the central Prometheus Server, you can use a small amount of RAM (512m should be enough).
- Because the tmpfs uses RAM as storage, the data in it is volatile and will be lost if the server restarts. Any data buffered in the WAL that had not been written to the central Prometheus server will be lost. This is normally not an issue, unless the central Prometheus server is unavailable for a long period of time before the agent reboots.
Applying the fix: Using a tmpfs mount point
The following steps are based on the assumption that we use Portainer to manage our Docker containers, as was covered in the Simple Container Management With Portainer and Portainer Agent: Managing Containers Across Servers articles.
Step One: Creating a tmpfs volume with Portainer
We are going to first create the tmpfs volume that we will later use from our Prometheus Agent container. To create the volume from the Portainer Web UI:
- Enable the Environment for the server that we want to make changes for.
- Select Volumes from the left-side menu, then click Add volume.
- Give the volume a name, for example: prometheus_data.
- Under Driver select local.
- Use the add driver option button to add the following options. Feel free to modify the value for size appropriately for your system.
| name | value |
|---|---|
type |
tmpfs |
device |
tmpfs |
o |
uid=65534,gid=65534,size=256m |
- Make sure the toggles for NFS and CIFS are turned off.
- Finally, click Create the volume.
Step Two: Configuring the Prometheus Agent
Now we have to add a mapping to the new volume from the prometheus container. To do this from the Portainer Web UI:
- Go to the Environment for the server that we want to make changes for.
- On the left-side menu, click the Containers section and then click on the prometheus container.
- On the Actions panel at the top of the page, click on Duplicate/Edit.
- At the bottom of the next page, under Advanced container settings, select Volumes and click on map additional volume.
- Set the container path to the following:
/prometheus/data-agent - Under volume, select the tmpfs volume you created previously. Make sure the volume is set to Writable.
- Click on Deploy the container and in the pop-up window, confirm that you want to Replace the existing container.
- Go back to the Containers section, and make sure the prometheus is running. If it is not, select it and use the Start button from the action bar at the top.
Step Three: Verify the Fix
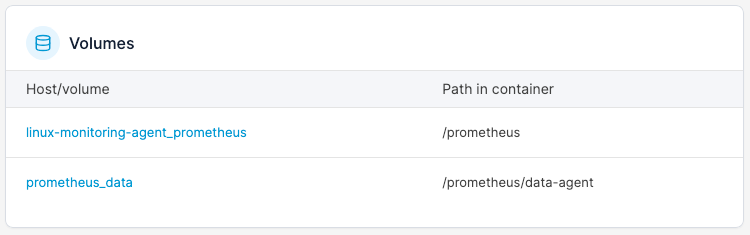
You can verify that the settings were applied correctly by going to the container details for prometheus and looking at the Volumes section near the bottom:
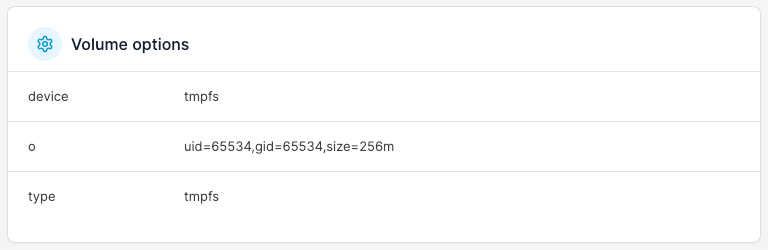
If you click on the prometheus_data volume, you should see the options we gave to the tmpfs volume earlier:
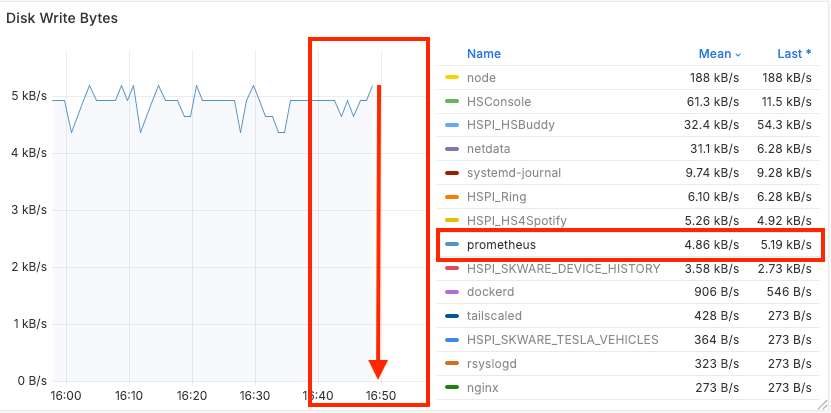
If you imported the sample Grafana dashboards linked from the article Real-Time Server Monitoring with Prometheus and Grafana, you can go to the Processes dashboard and select the node for the Prometheus Agent. Click on the name of the process prometheus from the labels at the right of the Disk Write Bytes graph. The effect of the fix should be pretty obvious:
What's Next?
You can apply this same fix to other processes that may be generating a lot of disk write operations for data that does not require persistence across server reboots. For example, if you use Plex for media streaming, you can assign a tmpfs volume to the path that Plex uses to store the output of real-time video transcoding, since that data is only needed during a streaming session. This will not only reduce the amount of disk activity but it may also increase the performance of the transcoding operation.